This is in part because they changed how CPI is calculated in the 80s and 90s, which, as luck would have it, lowered the rates. You can see what CPI looks like with the older formulas here to compare:
Shadowstats is one of the dumbest websites on the internet. It doesn't remotely compare to the older formulas, it just applies a random consistent number to US stats and says "They're undercounting!". If they really "recalculated" it wouldn't be a mirror of the official numbers.
Think about it logically, per their dumb chart, inflation has averaged ~10% since 2000? and something like 7% in the 1990s? That easily gets you to over 1,000% total inflation in the past 30 years. Are you paying 10x for anything compared to the 1990s? TVs? Computers? Food? Gas? Furniture? Cars?
The "C" in CPI stands from consumer, not assets. It is a measure of the cost of goods and services that people consume. Assets are not consumed so therefore not in the CPI.
> Also look at shrinkflation
Contrary to popular opinion, the people who calculate the CPI are not complete morons. See StatCan's (who do the CPI in Canada) handbook:
> 7.10 Quantity adjustment entails accounting for changes in the quantity (e.g. package size, number of tissue ply, etc.) of observed POs. This is another implicit method of quality adjustment because it is assumed that the quality per standardized unit is the same over time.
> 7.11 Quantity adjustment is the default treatment for nearly all of the POs in the food major aggregate as well as some of the products in the household operations, and personal care supplies and equipment aggregates.
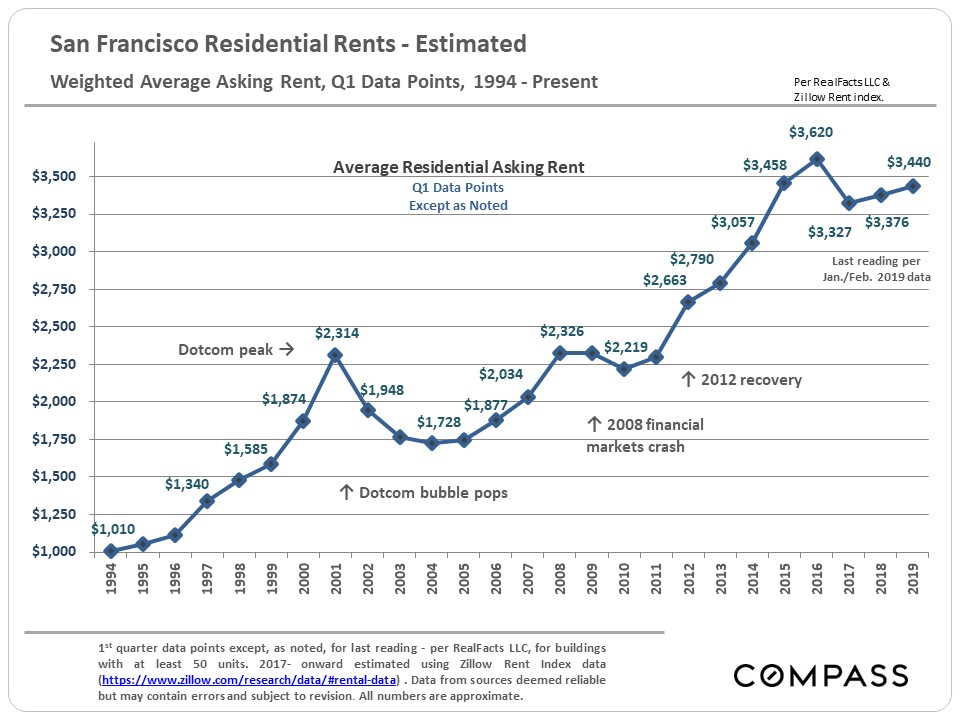
Even in the most expensive cities in the US, rents are "only" up something like 250% in the past 30 years. And in most of the country, it's a small percentage of that.
Do you think that the economy has shrunk in half in real terms in the last 20 years? Because that’s essentially what it would mean for those numbers to be true.
http://www.shadowstats.com/alternate_data/inflation-charts